Disclaimer: This article is for informational purposes and does not constitute medical or legal advice.
The ink on the M&A deal is barely dry, and the pressure is on. The board wants cooperation (a word referred to as ‘synergy’ in the AI world), the CFO wants ROI, and clinicians want to care for patients without logging into three different EHRs. In the chaos of a post-merger integration, gut feelings are a recipe for disaster. Success hinges on tracking the right Key Performance Indicators (KPIs). This article defines the five non-negotiable KPIs that predict integration success: Time-to-First-Interface, Automated ADT Reconciliation, Interface Downtime, Duplicate Patient Record Rate, and 30-day Readmission Rate stability. We provide benchmarks, a solutions scorecard, an 18-month roadmap, and an illustrative ROI model to arm you for the battle ahead. This is your playbook for choosing the right healthcare interoperability solutions and delivering on the promise of your merger.
Why KPIs Beat Gut, Feel After a Merger
Let’s be honest. The moment an M&A deal closes, two clocks start ticking. The first is the board’s ability to measure time-to-value. The second is the clinicians’, measuring the time until technology-induced fatigue boils over into burnout. I’ve lived this. When I was CIO at Texas Health Resources, we went through numerous integrations. In one instance, a vendor promised a seamless merge of the LIS (Lab Information System). Spoiler: it wasn’t. We spent months untangling point-to-point interfaces, and the promised “bliss” felt more like a curse. The CFO, rightly, was concerned about the mounting costs and delayed ‘synergies.’
That experience taught us a crucial lesson: hope is not a strategy. A successful M&A data integration isn’t about vendor promises; it’s about measurable performance. Delaying integration doesn’t just frustrate people; it burns cash. According to KPMG, health systems can lose between $300,000 and $500,000 per month in unrealized value from delayed IT integration. And that doesn’t even account for the clinical risks.
This is where a rigorous, KPI-driven approach becomes a CIO’s best friend. It transforms tense conversations with the C-suite from subjective debates into objective, data-driven strategy sessions. It provides a framework for holding vendors accountable and gives your team a clear definition of “done.”
KPI #1: Time-to-First-Interface (TTFI)
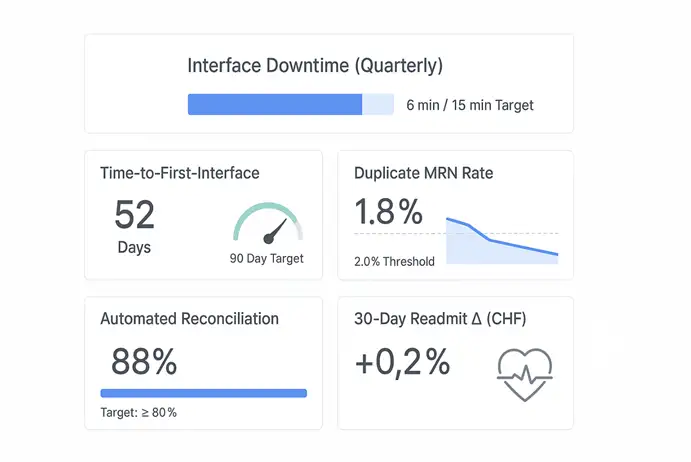
Target: ≤ 90 days post-close
What It Is: TTFI measures the speed at which you can establish the first critical data connection between the acquiring and acquired entities—typically, sharing basic patient demographic and encounter data (ADT feeds) between two different EHRs. It’s the foundational first step.
Why It Matters: Speed is everything in a merger. A low TTFI demonstrates immediate progress to a nervous board and delivers a quick win for clinical teams, who can now, at a minimum, verify if a patient has been recorded at the other facility. A high TTFI, on the other hand, signals deeper problems and allows operational costs to accumulate as staff rely on manual workarounds. According to the KLAS Interoperability Platforms 2024 report, leading platforms are distinguished by their ability to accelerate this initial connectivity.
Two-Step Self-Audit:
- Ask your integration vendor: “What is your guaranteed, penalty-backed SLA for establishing a bidirectional ADT feed between Epic® and Cerner®?”
- Ask your team: “What are the three biggest technical and bureaucratic roadblocks to getting data-sharing agreements and security approvals signed in the first 30 days?”
Vignette from the Trenches:
The deal for the 220-bed hospital closed on a Tuesday. By Friday, our new CFO was at my door. “Ed,” he said, “the board presentation is in 90 days. I need to show a unified census report. Can you do it?” In the past, this would have been impossible. The old way involved months of negotiating specs for point-to-point interfaces, endless testing, and finger-pointing between vendors. But this time was different. We had invested in a modern integration platform. Instead of building from scratch, we configured pre-built connectors. Our team established a secure ADT feed in 52 days. The CFO got his unified census report with time to spare. It wasn’t just a technical win; it was a political one. We built credibility and gained the breathing room to tackle the more challenging integrations to come.
KPI #2: Automated ADT Message Reconciliation
Target: ≥ 80% automated reconciliation
What It Is: As patient data (admit, discharge, transfer messages) flows between systems, discrepancies are inevitable. This KPI measures the percentage of conflicts that your integration engine can resolve automatically without requiring a human data steward to intervene manually.
Why It Matters: Manual reconciliation is a hidden cost monster. It drains hundreds of HIM staff hours and directly contributes to the creation of duplicate records and patient safety risks. If a patient’s allergy information from one EHR doesn’t automatically sync with the other, the consequences can be dire. A high automated reconciliation rate, as benchmarked by HIMSS, is a direct indicator of a mature and intelligent integration platform. It’s the difference between a system that creates work and a system that does work.
Two-Step Self-Audit:
- Pull a report from your interface engine: “For every 1,000 inbound ADT messages from our newly acquired hospital, how many are being flagged for manual review?”
- Survey your HIM team: “On a scale of 1-10, how confident are you in the patient data coming from the new facility’s systems?”
Vignette from the Trenches:
From a clinical perspective, this is where the rubber meets the road. I was reviewing the chart of a patient transferred from the newly acquired hospital for an urgent cardiac procedure. His record showed no history of bleeding disorders. However, as we prepared him, a nurse practitioner who had worked at the other hospital recognized his name. “Wait,” she said, “I think this patient has von Willebrand disease.” A frantic call confirmed it. The critical diagnosis was in the other system but had been placed in a manual reconciliation queue due to a mismatched address format. We narrowly avoided a catastrophic bleed. And it was a stark reminder: an 80% automated reconciliation rate isn’t just a technical goal; it’s a patient safety imperative.
KPI #3: Interface Downtime
Target: < 15 minutes per quarter
What It’s: This one is simple. It’s the total amount of time your critical interfaces are down and not passing data. This includes both unplanned outages and scheduled maintenance windows.
Why It Matters: Interface downtime is essentially EHR downtime. When interfaces fail, the entire clinical workflow grinds to a halt. Clinicians can’t see new lab results, orders don’t cross to the pharmacy, and patient data becomes dangerously fragmented. The CHIME annual downtime survey highlights that even minutes of downtime can have significant financial and clinical impacts, disrupting everything from billing to patient care. A resilient, high-availability integration architecture is non-negotiable.
Two-Step Self-Audit:
- Review your last 12 months of IT trouble tickets: “How many ‘sev-1’ incidents were related to a failed interface, and what was the mean-time-to-resolution?”
- Ask your potential vendor: “Describe your failover architecture and your process for applying patches with zero clinical-facing downtime.”
Vignette from the Trenches:
It always happens at 2 AM on a Saturday. That’s a rule. We got the call: the HL7 feed carrying lab results from the acquisition into our core Epic EHR was down. A server patch at the other hospital had failed. In the past, this meant waking up two engineers, a network administrator, and an analyst. It was a four-hour, all-hands-on-deck fire drill. This time, our iPaaS solution detected the outage in seconds, automatically rerouted the message queue to a secondary endpoint, and logged an alert. The on-call analyst received a notification, verified that the reroute was working, and then went back to sleep. Total downtime? Six minutes. The ED physicians never even noticed. That’s the standard we have to aim for.
KPI #4: Duplicate Patient Record Rate
Target: ≤ 2%
What It Is: The percentage of patients in your Master Patient Index (MPI) who have more than one medical record number (MRN). M&A activity is notorious for causing this number to skyrocket.
Why It Matters: Duplicate records are a significant issue for patient safety and revenue cycles. They split a patient’s story in half, hiding allergies, past diagnoses, and medications. This leads to repeated tests, medical errors, and denied claims. AHIMA has extensively documented that a duplicate rate above 2% is untenable, with the cost to resolve a single duplicate estimated at over $100. A superior healthcare interoperability solution includes a robust Enterprise Master Patient Index (EMPI) with probabilistic matching algorithms to prevent duplicates before they’re ever created.
Two-Step Self-Audit:
- Run the numbers: “What was our duplicate rate before the acquisition, and what is it 60 days post-close?”
- Analyze the source: “What percentage of new duplicates are being created at registration versus during back-end data migration?”
Vignette from the Trenches:
We had a patient, “Robert Jones,” register at our main campus. The system, using a basic deterministic algorithm, didn’t flag a potential duplicate. A few days later, a “Bob Jones” with a slightly different birthday registered at the newly acquired clinic. The result? Two charts. Robert’s critical heart medication was on one, and Bob’s new prescription for a conflicting drug was on the other. The pharmacist caught it only because the addresses were identical. This is a classic M&A failure mode. Probabilistic matching—which looks at names, nicknames, addresses, phone numbers, and other factors—would have flagged this with 99% certainty. Investing in a top-tier EMPI isn’t a luxury; it’s a fundamental risk management strategy.
KPI #5: 30-Day Readmission Rate Change
Target: ± 0% post cut-over
What It Is: This is the ultimate clinical outcome metric. It measures whether your 30-day all-cause readmission rate for key conditions (such as CHF or COPD) changes in the months immediately following the integration goes live. The goal is neutrality—proof that the technology change did not harm.
Why It Matters: As Dr. Wachter and others have argued in NEJM Catalyst, the primary directive of any clinical technology project is to maintain continuity of care. A spike in readmissions is a massive red flag that something is broken in the new workflow. Discharge medication lists aren’t reconciling correctly, or follow-up appointments aren’t being scheduled across facilities. Holding this metric stable proves that your integration is not only technically sound but also clinically safe. It’s the KPI that tells you if you’ve successfully connected systems without disconnecting care.
Two-Step Self-Audit:
- Consult your quality team: “What is our baseline 30-day readmission rate for CHF, and what is the plan to monitor it weekly for the first 90 days post-go-live?”
- Talk to clinicians: “Ask five recently discharged patients if their transition of care felt seamless. Ask five case managers if they have all the information they need to prevent a readmission.”
Vignette from the Trenches:
Everyone was celebrating the successful technical go-live. The dashboards were green, and the interfaces were humming. But two weeks later, our Chief Quality Officer presented the data: a 15% jump in readmissions for pneumonia patients coming from the acquired hospital. We dug in. The problem was subtle. The new hospital’s discharge summary format wasn’t mapping the “Follow-up appointment needed within 7 days” field correctly. The instruction was being dropped. Therefore, patients were being discharged home without a critical first follow-up appointment scheduled. We fixed the mapping, and the Rate returned to baseline the next month. It was a powerful lesson: technical success means nothing without clinical validation.
Solution Scorecard: Matching the Tool to the Job
Not all healthcare interoperability solutions are created equal. Your choice of architecture has a direct impact on your ability to hit these KPIs.
| KPI (Target) | Point-to-Point | Enterprise Service Bus (ESB) | API Gateway | iPaaS (Integration Platform as a Service) |
| TTFI (≤ 90 days) | Poor | Fair | Good | Excellent |
| Auto-Reconciliation (≥ 80%) | Poor | Fair | Fair | Excellent |
| Downtime (< 15 min/qtr) | Poor | Good | Good | Excellent |
| Duplicate Rate (≤ 2%) | Poor | Fair | Fair | Excellent |
| Readmit Stability (± 0%) | Fair | Good | Good | Excellent |
Note: Ratings are illustrative and depend on specific vendors and implementation quality.
Point-to-point connections are brittle and don’t scale—a lesson many of us learned the hard way. ESBs were an improvement but are often cumbersome and on-premise. Modern API gateways are excellent for specific, well-defined use cases. Still, they can lack the broader transformation and orchestration capabilities needed for complex M&A. An iPaaS, designed for the cloud, combines the best of these worlds: agility, scalability, pre-built healthcare connectors, and advanced data management tools, making it the superior choice for the dynamic, high-stakes environment of post-merger integration.
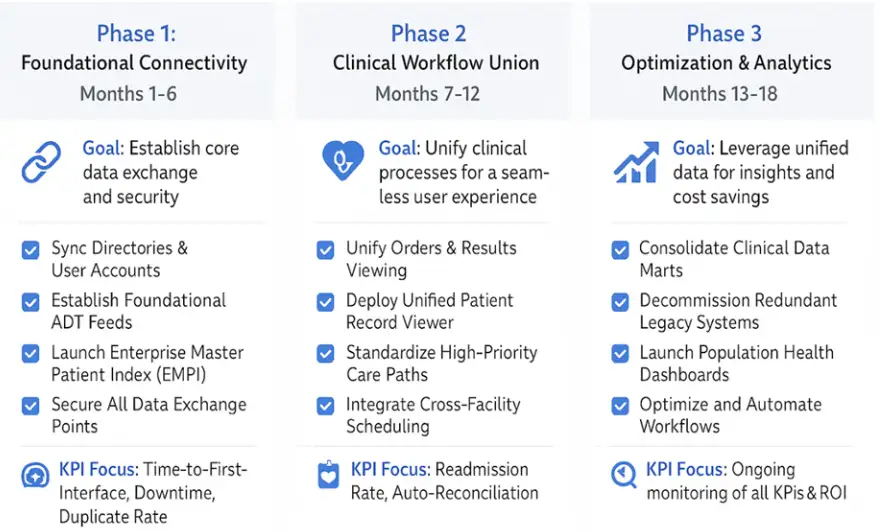
18-Month Integration Roadmap & ROI
Success requires a plan. Here is a high-level, 18-month roadmap that aligns with the KPIs.
And what about the ROI your CFO is demanding? While specific numbers vary, the business case is clear. The investment in a modern integration platform pays for itself by retiring legacy systems, reducing manual labor, and preventing costly clinical errors.
Illustrative ROI/Payback Calculation
| Metric | Point-to-Point | ESB | iPaaS |
| Illustrative Capex | $750,000 | $1,500,000 | $1,200,000 (Subscription) |
| Legacy System Decommissioning | $100,000 | $250,000 | $400,000 |
| Reduced Manual Reconciliation | $50,000 | $150,000 | $350,000 |
| Duplicate Record Prevention | $75,000 | $200,000 | $300,000 |
| Total Annual Savings | $225,000 | $600,000 | $1,050,000 |
| Payback Period (Illustrative) | 3.3 Years | 2.5 Years | 1.1 Years |
Disclaimer: All financial figures are illustrative and for estimation purposes only. Actual ROI will vary based on organizational scale, complexity, and vendor contracts.
FAQs: Selecting Healthcare Interoperability Solutions After an M&A
Alt-text: A graphic of a whiteboard with three pastel yellow sticky notes. The notes have handwritten-style text: “How fast?”, “How safe?”, “How much?”. They are attached with blue pushpins.
1. What’s the single biggest mistake CIOs make in post-merger integration?
They underestimate the complexity and try to solve a strategic problem with a tactical tool. Relying on the EHR vendor or building brittle, point-to-point interfaces is a common trap. You need a dedicated, enterprise-grade healthcare interoperability solution that is vendor-agnostic and built for scale.
2. How do we get clinician buy-in for yet another IT project?
You don’t position it as an IT project. You frame it around their pain points. Leading with the KPIs that matter to them: reducing duplicate records that cause safety risks, eliminating downtime that disrupts their workflow, and ultimately, ensuring readmission rates don’t climb. You deliver quick wins, like a unified view of the patient record, to build trust.
3. Our two organizations use different EHRs (Epic® and Meditech®). Is a “rip-and-replace” strategy better?
Rarely. A “rip-and-replace” is incredibly expensive, disruptive to clinical operations for years, and forces one group of clinicians to abandon a system they know. A coexistence strategy, powered by a robust integration platform, is faster, cheaper, and less painful. It allows you to achieve 80% of the value (unified data, seamless workflows) for 20% of the cost and disruption, preserving capital and clinician sanity. You can learn more about this approach in our guide to a HIMSS Stage 7 roadmap.
Your Next Move
The war room beckons. The challenges of M&A integration are immense, but they are not insurmountable. By focusing on the right KPIs and choosing the right architectural partner, you can navigate the complexities, deliver measurable value, and fulfill the strategic promise of your merger.
Don’t leave your success to chance.
Ready to build a data-driven integration strategy? Book a 30-minute, no-obligation session with Logicon’s integration architect today. We’ll help you map your current state and build a KPI-driven plan for a zero-downtime, clinically-safe integration.