LOGICON

Tag: Digital Transformation

  • 5 Proven User Adoption Strategies for a Successful Digital Transformation

    Enterprises will invest $3.4 trillion in digital transformation programs by 2026; however, approximately 70% will still fail to meet their business targets. That failure isn’t rooted in code or cloud; it’s associated with people. The yawning gap between installed software and adopted software – the adoption gap – is where ROI quietly slips.

    Getting software live is easy; getting people to use it isn’t. This guide covers five evidence-based moves to turn tools into an advantage and show up on the P&L.

    The Adoption Gap: Why Digital Transformations Stall

    • $900 billion is lost each year on digital projects that under-deliver.
    • 62% of new features remain unused; organisations capture only 43% of planned value.

    For a CIO, that threatens the business case she sold to the board. For Ops Director, it surfaces as shadow spreadsheets, workarounds, and slumping morale. The root causes are consistently human:

    Root CauseFront-Line Impact
    Poor communication—no one understands whyRumours, disengagement
    Inadequate training—86 % feel under-skilledError spikes, ticket volume soars
    Workflow mismatch—tool ignores realityReversion to legacy habits

    Strategy 1 – Embed User-Centred Design From Day One

    Don’t design in hiding. Meet users, spot friction, and co-create with ‘change champions’ who can test and spread the word.

    KPI Snapshot

    • User-centred design lifts adoption ↑ by 78 %
    • Champion networks raise success odds ↑ by 73 %

    Mini-Case – Large Health System
    By co-configuring an EHR with a clinician council, a said hospital achieved 78% active usage in the first month, surpassing industry benchmarks.

    Strategy 2 – Craft a Compelling & Continuous Change Narrative

    Answer everyone’s WIIFM—“what’s in it for me?” Tailor messages by persona and share them via town halls, podcasts, Slack AMAs, and floor walks. Keep leaders visible; credible sponsorship can boost success by ~83%.

    Positive-sentiment tracking showed a 79% surge before go-live, moving skeptics into advocates.

    Strategy 3 – Deliver Comprehensive, Persona-Based Enablement

    One two-hour webinar is just a compliance checkbox. The best programs build role-based learning paths with:

    • Short micro-videos for quick recall
    • Safe sandboxes to try, fail, and reset
    • Peer coaching (desk-side or Zoom) with certified power users

    The mandate: build confidence + proficiency, not just attendance.

    KPI Snapshot
    Blended enablement cuts help-desk calls ↓ by 73 % and drives proficiency to ≈ 90 %.

    Mini-Case – Global Consulting Firm
    Generic tutorials resulted in revolt. Swapping them for role-specific boot camps led by senior-partner super-users vaulted credibility and reduced support tickets by 73%.

    Strategy 4 – Drive Motivation Through Recognition & Incentives

    Sustained behavior change hinges on Daniel Pink’s trifecta: purpose, autonomy, and mastery.

    1. Purpose | Link tasks to mission (“This dashboard frees you to serve clients, not chase data”).
    2. Autonomy | Let teams customize views and shortcuts.
    3. Mastery | Highlight experts, run “Ask-Me-Anything” clinics.

    Layer in extrinsic sparks – leaderboards, digital badges, quarterly “Adoption Oscars,” and spot bonuses.

    KPI Snapshot
    Gamified recognition sustains adoption ↑ by 79% and ignites early engagement ↑ by 63%.

    Mini-Case – SaaS Collaboration Roll-out
    A 90-day “Adoption League” awarded points for advanced features. Winners were applauded at the all-hands and pocketed bonuses. High-value feature usage increased by 94% and remained high after the contest.

    Strategy 5 – Manage Adoption With Data-Driven Interventions

    Instrument the platform with a Digital Adoption Platform (DAP) to capture:

    • Depth of feature use • Task completion times • Sentiment pulses

    Segment users into Champions, Strugglers, Resistors, and trigger precision nudges: in-app walkthroughs for newbies, one-to-one coaching for laggards, spotlight stories for stars.

    Mini-Case – National Health Insurer
    DAP analytics flagged veteran adjusters skipping a validation step. Instead of mandating compliance, ops launched a contextual pop-up showing how the step cut rework in half. Adherence reached 9%, unlocking $42 million in annual savings.

    An Integrated Implementation Road-Map

    PhaseKey MovesSuccess Signals (Why It Matters)
    1 Readiness Audit• Stakeholder map • Culture heat-map • Risk registerScope is realistic; change narrative resonates before code is written
    2 Pilot• Spin-up sandbox • Run with cross-functional slice • Capture baseline metricsLow-risk proof; quick wins fund momentum
    3 Phased Roll-out• Wave releases • Champion network amplifies • Agile retros strengthen each waveLessons compound; the adoption curve accelerates
    4 Change-Management COE• Stand-up COE • Publish playbooks • Own governance & ethicsSingle source of truth; consistency across geos & functions
    5 Monitor & Intervene• DAP dashboards • Pulse surveys • Targeted coaching nudgesMetric drift caught early; ROI protected
    6 Transition to BAU• Embed ownership in line orgs • Refresh KPIs quarterly • Continuous-learning loopsAdoption muscle becomes an everyday habit; momentum endures

    Quick-Win Checklist

    ✓ Sign up champions in Week 1
    ✓ CEO plugs the project into the next all-hands
    ✓ Publish a “Top 5 Quick-Win Features” cheat-sheet

    Building the Business Case for Adoption

    MetricWithout StrategyWith Strategy
    Profit lift+23 %
    Digital-upgrade revenue promise delivered56 % → 30 % realised56 % → 53 % realised

    Breakeven Math

    • Investment in change-management: $250 k
    • Monthly benefit: $60 k (productivity + support)
    • Payback: ≈ 4.2 months

    Common Pitfalls & How to Dodge Them

    PitfallRapid Fix
    Treating go-live as the finish linePlan 90-day hyper-care with daily metric reviews
    Radio-silence communicationsLock a multi-channel cadence—announce even small wins
    No success KPIsDefine and instrument metrics before Phase 2
    Ignoring resistorsHost listening tours; mine feedback for workflow flaws
    One-and-done trainingSchedule quarterly refreshers and embed onboarding

    Future-Proofing Your Adoption Muscle

    1. Deploy DAPs at scale – in-app guidance, heat-maps, real-time analytics.
    2. Pilot AI Tutors – LLM-powered coaches that answer “How do I…?” inside the app.
    3. Adopt VR/AR – immersive practice for shop-floor setups, field repairs, or surgical drills.

    Conclusion: Technology Is Only Half the Equation

    Software doesn’t create value—people using software well do. Make these five user-adoption strategies the backbone of every transformation, and you trade hope for control, risk for reward. Your biggest liability—an under-prepared workforce—becomes your strongest asset: a confident, empowered team that squeezes every ounce of ROI out of your tech stack.

    Ready to elevate the human side of your next initiative? Book a complimentary User-Adoption Readiness Workshop with Logicon.tech and turn change into a competitive advantage.
  • Digital Transformation Roadmap to HIMSS Stage 7

    Digital Transformation Roadmap to HIMSS Stage 7

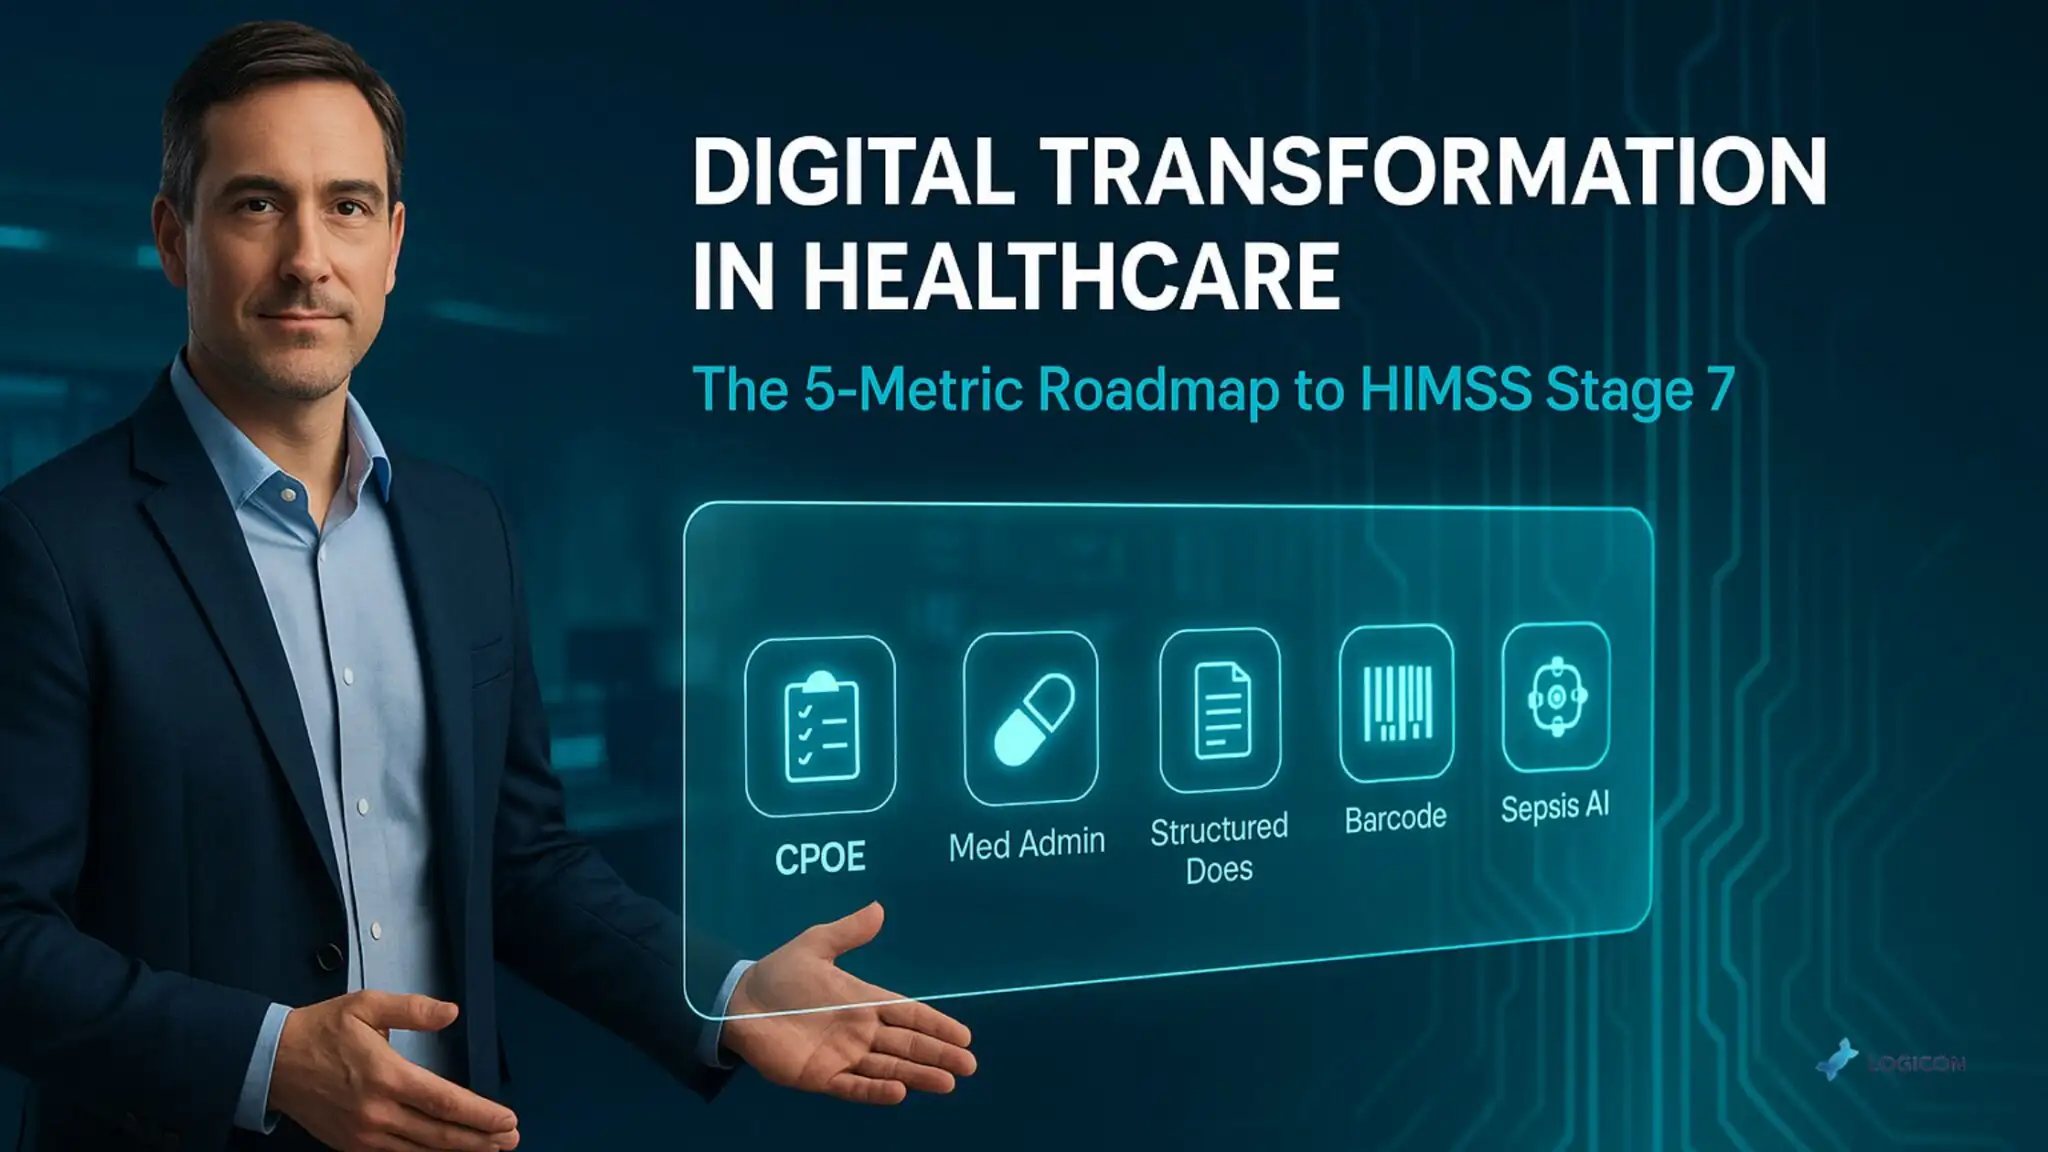
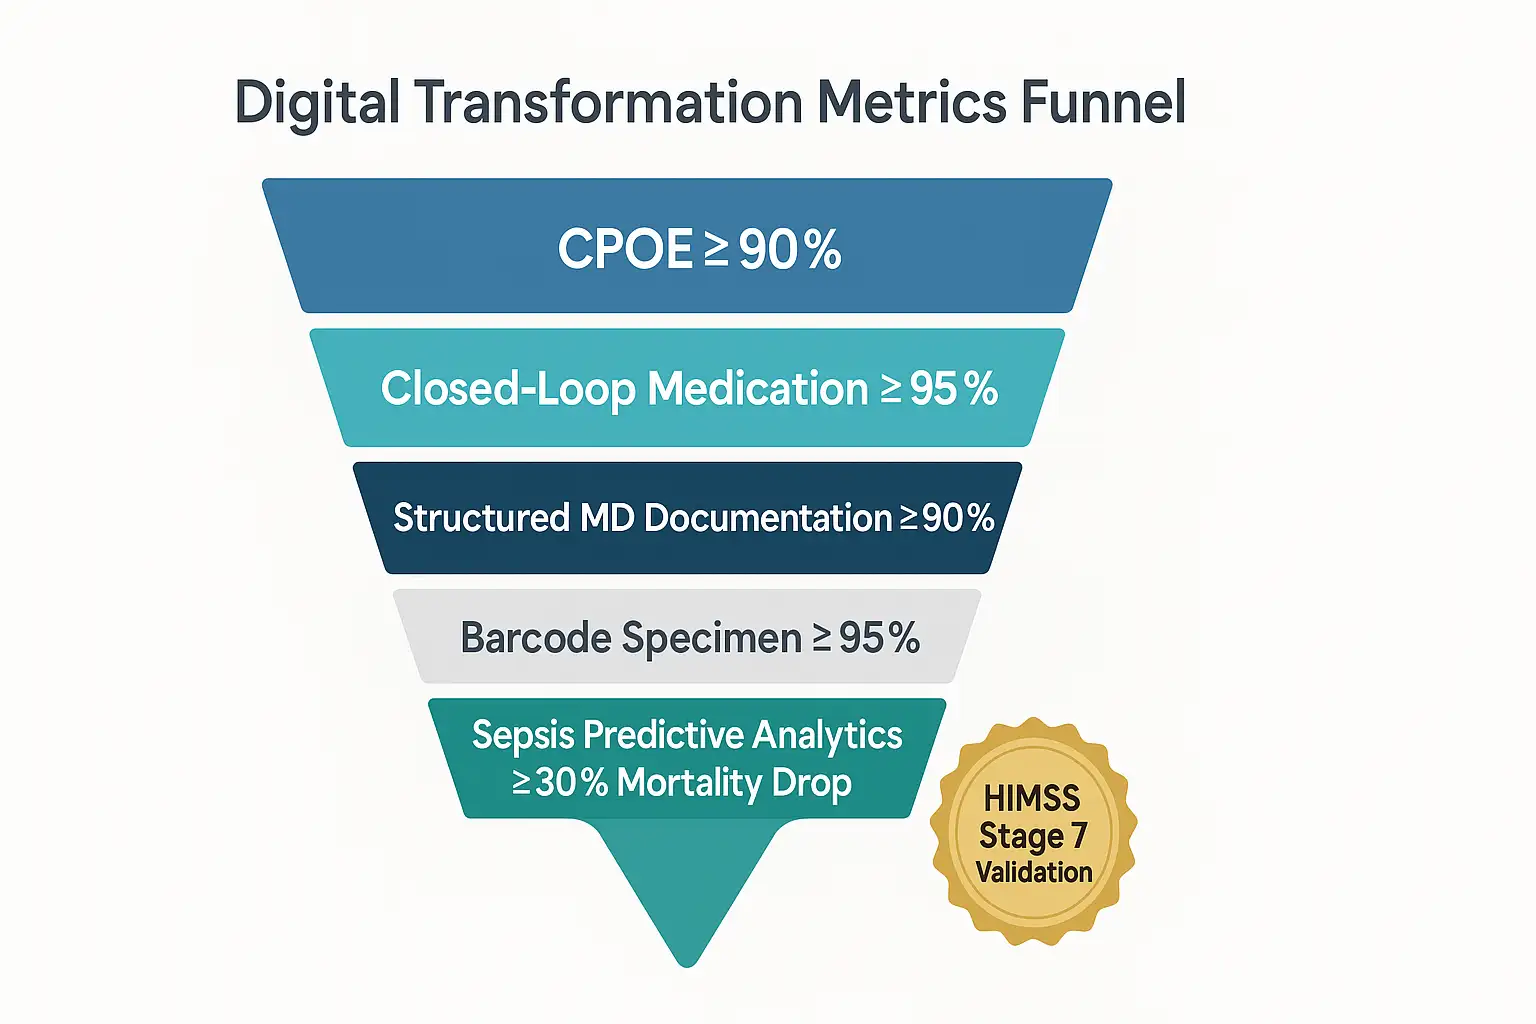
    If you’ve ever faced a boardroom skeptical about digital transformation in healthcare, you’re not alone. Metrics speak louder than milestones. HIMSS Stage 7 validation isn’t just a plaque on the wall; it’s proof your hospital’s digital investments yield clinical quality, financial return, and better patient outcomes. But achieving Stage 7 within two years isn’t easy. How do you get there? We distill the journey into five core metrics: CPOE utilization, medication administration accuracy, structured documentation, barcode specimen tracking, and predictive analytics for sepsis. This roadmap provides quarterly checkpoints, realistic financial ROI, and a touch of humor—because healthcare transformation needs it.

    Metrics Over Milestones: Why Boards Prefer Numbers

    Look, no one loves another dashboard—but boards crave clarity. When CFOs and CEOs hear “digital transformation,” they think, “Show me the numbers.” Milestones might be impressive to IT teams, but board members think in terms of measurable outcomes. From my days leading digital change at Texas Health Resources, I recall our CFO’s candid call: “Ed, if you want buy-in, start speaking in dollar signs and decimal points.” Metrics not only quantify progress but also justify financial investments. Quantified outcomes, such as reduced medication errors, improved clinician documentation, and decreased sepsis mortality, compel boards to invest and clinicians to embrace change.

    Metric 1: CPOE Utilization ≥ 90% for ≥ 4 Months

    Lay Definition: Computerized Physician Order Entry (CPOE) refers to the process by which doctors enter treatment orders electronically, thereby reducing manual errors.

    Stage 7 Requirement: HIMSS mandates sustained usage of≥ 90% CPOE for validation.¹

    Two-Step Self-Audit:

    • Check your current CPOE usage rate: Is it consistently over 85%?
    • Evaluate physician training: Can clinicians articulate the value of CPOE beyond “management wants it”?

    When I led the THR rollout, achieving our 90% target felt like Groundhog Day. We’d one cardiologist who would famously quip, “Computers are for Facebook, not medicine!” But after showing him our medication error reduction—from dozens per month down to fewer than three—he became our most prominent advocate. And yes, he now follows me on LinkedIn.

    Digital Transformation Metrics Funnel

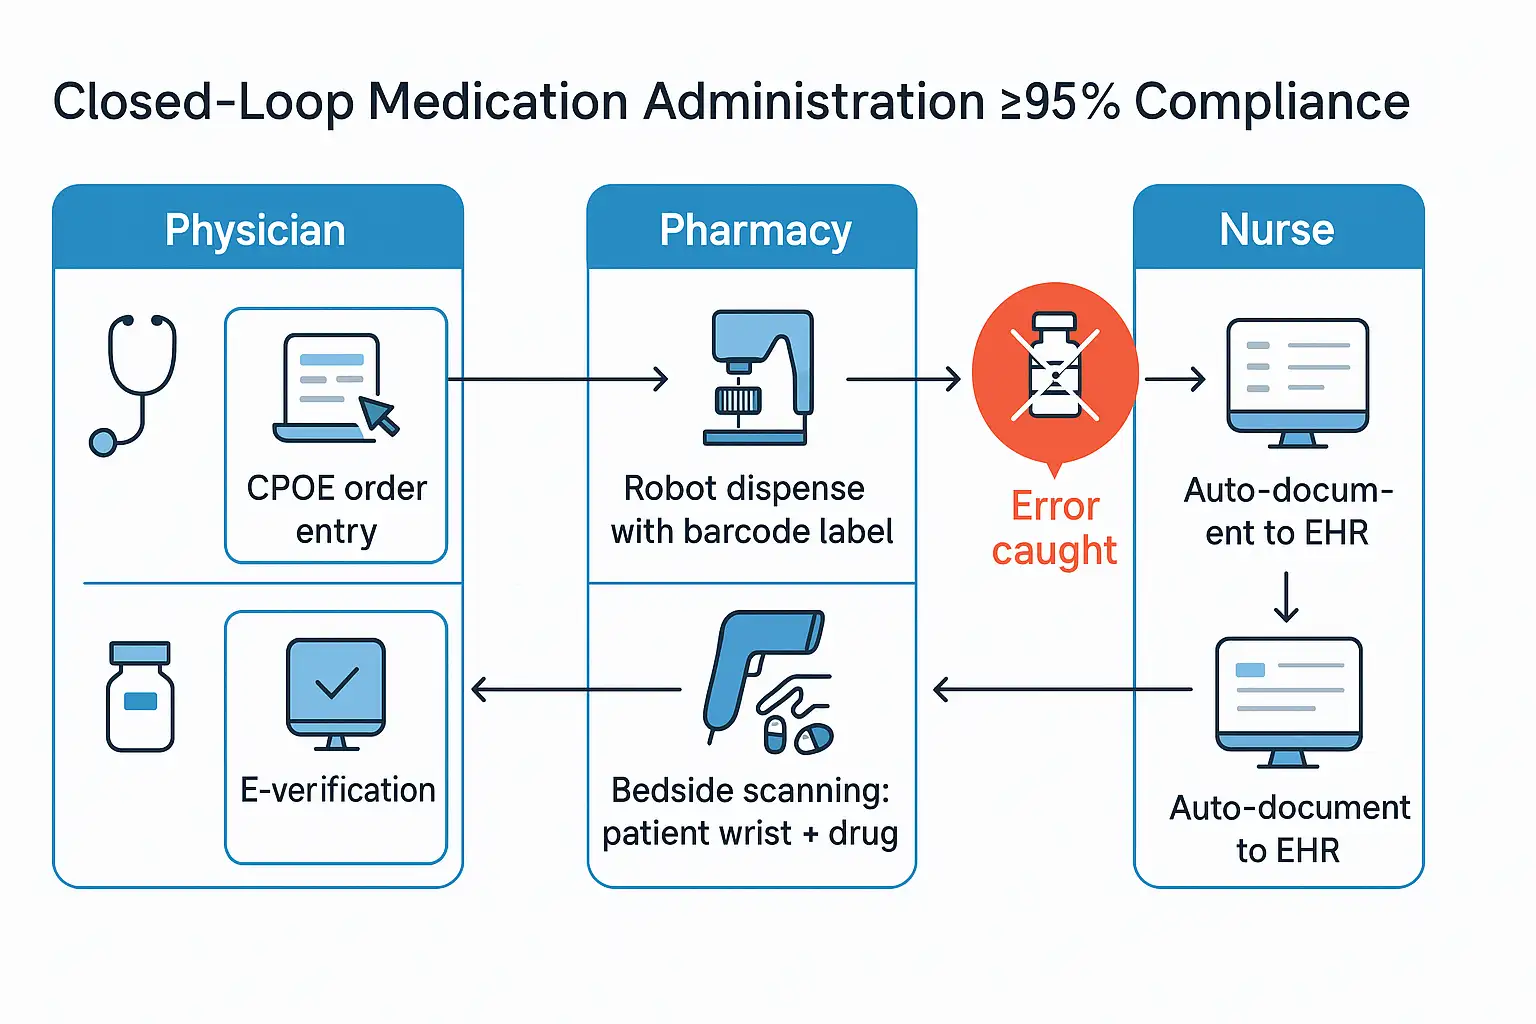
    Metric 2: Closed-Loop Medication Administration ≥ 95%

    Lay Definition: Ensures medications are correctly ordered, dispensed, administered, and documented electronically to minimize medication errors.

    Stage 7 Requirement: Closed-loop medication processes must reach ≥ 95% compliance.²

    Two-Step Self-Audit:

    • Assess medication error rates: Are manual errors still creeping in?
    • Review nurse workflows: Can nurses easily scan meds bedside without workarounds?

    At one Midwestern hospital, we found that nurses were bypassing barcode scans to save time, which led to preventable errors. After streamlining workflows and retraining, we hit 97% compliance. The nurses even hosted a “barcode party” (yes, a cake shaped like a barcode). Humor aside, closed-loop medication saves lives and budgets.

    closed-loop medication administration 95% compliance

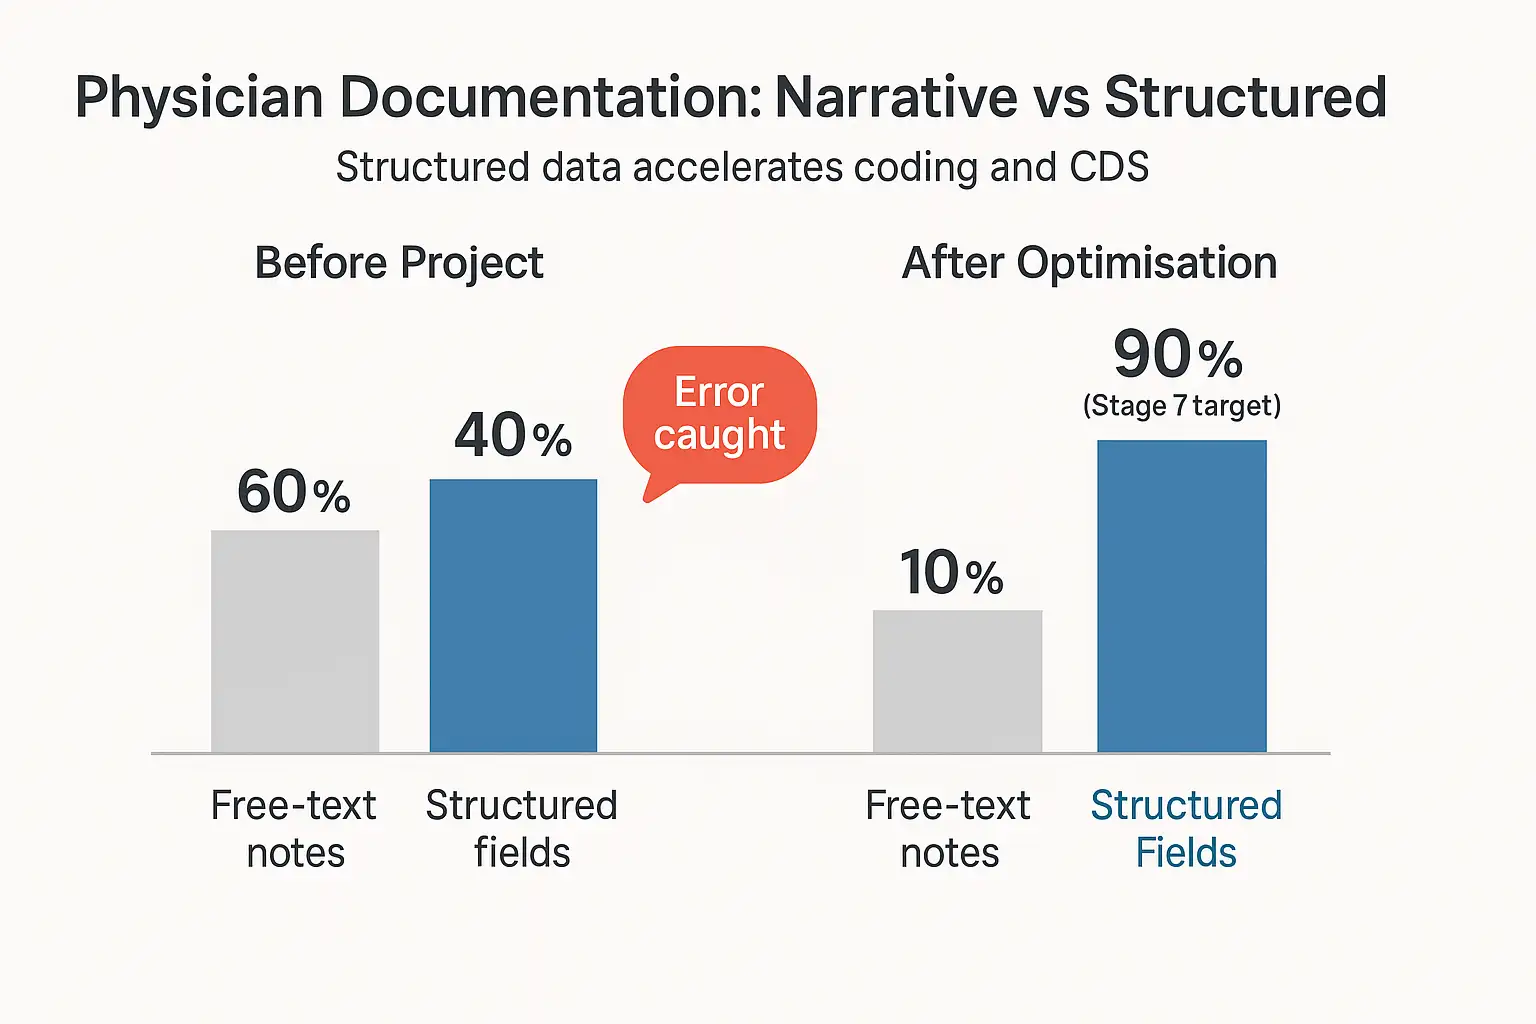
    Metric 3: Structured Physician Documentation ≥ 90% Discrete Data

    Lay Definition: Physicians document patient notes electronically in discrete, analyzable fields rather than free-text narratives.

    Stage 7 Requirement: HIMSS requires ≥ 90% structured, discrete physician documentation.³

    Two-Step Self-Audit:

    • Audit current documentation: Are doctors still favoring narrative notes?
    • Ease-of-use evaluation: Is EHR documentation intuitive and user-friendly?

    We once found a surgeon dictating notes to a tape recorder—yes, an actual cassette—in 2020! Shifting him to structured documentation wasn’t an overnight process, but discrete data led to faster coding, more accurate billing, and fewer denials. Revenue cycle management improved significantly, and our surgeon reluctantly admitted, “Okay, digital’s faster than tape.”

    Physician Documentation Narative vs structured

    Metric 4: Specimen/Blood-Product Barcode Scanning ≥ 95%

    Lay Definition: Specimens and blood products must be barcoded and scanned electronically to prevent errors in patient identification.

    Stage 7 Requirement: Barcode scanning compliance must exceed ≥ 95%, aligning with Joint Commission sentinel-event alerts.⁴

    Two-Step Self-Audit:

    • Analyze specimen error rates: How frequently are samples misidentified?
    • Assess barcode workflow: Is barcode scanning seamlessly integrated into clinical practice?

    A colleague at a 300-bed hospital once called this “the metric nobody loves until it saves a patient.” And that’s precisely what happened when our barcode system prevented a potentially fatal mismatch during a transfusion. Clinicians quickly became barcode evangelists—even sporting “Scan or Bust” stickers.

    [Insert barcode scanning compliance graph]

    Metric 5: Predictive Analytics Metric ≥ 30% Sepsis Mortality Drop

    Lay Definition: Using AI-driven analytics to predict sepsis earlier, reducing mortality rates.

    Stage 7 Requirement: Demonstrate analytics-driven sepsis mortality reduction ≥ 30%, inspired by Duke Health’s Sepsis Watch.⁵

    Two-Step Self-Audit:

    • Review sepsis mortality data: Do you have a clear baseline mortality measurement?
    • Evaluate analytic readiness: Is predictive analytics operational in clinical workflows?

    At Cleveland Clinic, implementing predictive sepsis analytics initially drew skepticism. One doc joked, “AI—Another Irritation?” But after seeing a 35% mortality drop within a year, skeptics became champions. Clinicians trusted data-driven alerts, and the board saw measurable ROI.

    [Insert predictive analytics impact graph]

    Your 24-Month Roadmap to HIMSS Stage 7

    Here’s your quarter-by-quarter plan to hit Stage 7:

    Quarter Milestones
    Q1–Q2 Baseline audits, infrastructure investment, clinician training
    Q3–Q4 Achieve CPOE ≥ 90%, Closed-loop med admin ≥ 80%
    Q5–Q6 Structured documentation ≥ 75%, barcode scanning ≥ 90%
    Q7 Predictive analytics pilot, refine workflows
    Q8 All metrics at Stage 7 levels, final audit prep

    ROI Snapshot (24-month projection)

    Metric CapEx ($) Annual Savings ($) Payback Period
    CPOE 150k 250k (error reduction) 8 months
    Closed-loop Med 200k 400k (med errors) 6 months
    Structured Doc 100k 350k (coding/billing) 4 months
    Barcode Scanning 120k 200k (specimen errors) 7 months
    Predictive Analytics 300k 600k (mortality reduction, LOS) 6 months

    Mini-FAQs: Digital Transformation in Healthcare

    Why prioritize metrics over milestones?

    Metrics quantify progress and justify investment clearly to boards.

    Is predictive analytics worth it?

    Yes—proven ROI includes significant clinical improvements, such as Duke’s sepsis mortality drop.

    What’s the most significant barrier to reaching Stage 7?

    Clinician buy-in. Address with clear benefit communication and workflow optimization.

    Ready to Transform?

    Metrics drive clarity, clinician buy-in, and measurable ROI. Let’s map your path to Stage 7.

    Book a 30-minute whiteboard session with Logicon.